1. Basic Pattern Analysis for Blood Glucose Monitoring
Request that patients record blood glucose results on paper, in a log book, or use an app/software program associated with the glucose meter. Explain that it is most helpful to see results organized by time of day to assess for patterns.
- First, look for pattern of low blood sugars.
-consider asking, "How often are your readings below 4 mmol/L? How often are you are weak, shaky, sweaty?" - Second, look for pattern of high blood sugars.
-not all readings need to be in target - don't worry about the occasional, higher readings - Ask yourself if A1c level agrees with results?
-if not, consider whether A1c is accurate or due for repeat
-if not, consider that you may be missing data that could be contributing to higher/lower A1c level
2. Basic Pattern Analysis for Continuous Glucose Monitoring using Ambulatory Glucose Profile (AGP)
As most CGM systems are collecting glucose data every 5 minutes, it is helpful to look at the large amount of data in a combined, graph form. The Ambulatory Glucose Profile (AGP) is a common tool used by all CGM systems. The AGP combines glucose results over several days or weeks into a single graph.
Please also see resources in the Topics Catalogue under Continuous Glucose Monitoring
The following is an example of an AGP.
Basic Diabetes Workshop participants: The following is Darpak's AGP results for the past month.
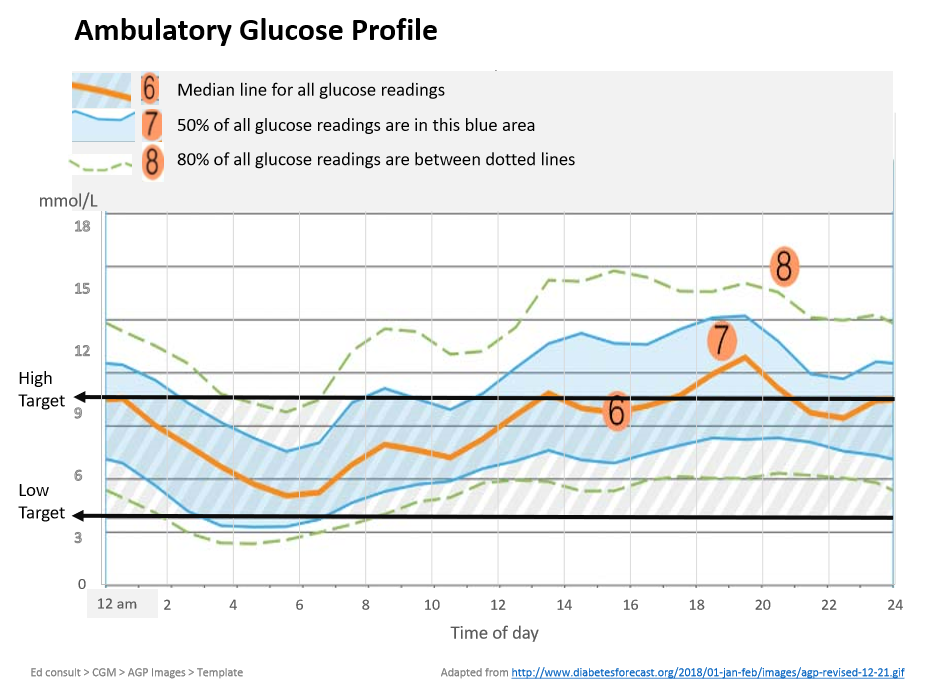
HOW TO INTERPRET AMBULATORY GLUCOSE PROFILE (AGP)
First, understand the graph:
- Target Range:
- Appears as light grey band between the low and high targets.
- Usually comes preset into the CGM device and may need to be changed to reflect patient’s A1c target.
- Remember to set higher target for after meal excursions – for example, set up to 8 or 10.
- Orange line- #6:
- Represents the median – half glucose levels are above this line and half fall below.
- Ideally, mostly flat and within target range.
- Blue shaded area -#7 (interquartile range or blue river):
- Represents 50% of all glucose levels.
- Ideally, the space narrow and within the target range.
- The wider the space the greater the glycemic variability.
- Area between dotted lines -#8:
- Represents 80% of all glucose values.
- 10% of glucose values are above the top line (90th percentile) and 10% of glucose values are below the bottom line (10th percentile).
Then, follow same steps as for Blood Glucose Pattern Analysis:
- First, look for pattern of lows.
-Does any part of the curve fall below the low target? What time of day is this happening? - Second, look for pattern of highs.
-Does any part of the curve go above the high target? What time of day is this happening? - Lastly, does the A1c level agree with the results?
-If not, consider whether A1c is accurate or due for repeat
-If not, consider whether you are missing data that may be contributing to higher/lower A1c level.
To learn more about CGM and AGP:
International Diabetes Centre AGP: http://agpreport.org/agp/learning
Frontier Case Studies (Abbott sponsored)
Clinical Targets for Continuous Glucose Monitoring Data Interpretation: Recommendations From the International Consensus on Time in Range. Diabetes Care, 2019 Aug; 42(8): 1593–1603 https://dx.doi.org/10.2337%2Fdci19-0028